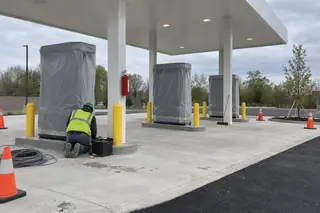
How much do gas station owners make? IRS data for tax year 2023 puts average net income at about $33,200 for gas stations filed as sole proprietorships, and about $84,200 for the ones that turned a profit. About 43 percent of those 8,157 returns reported a loss.
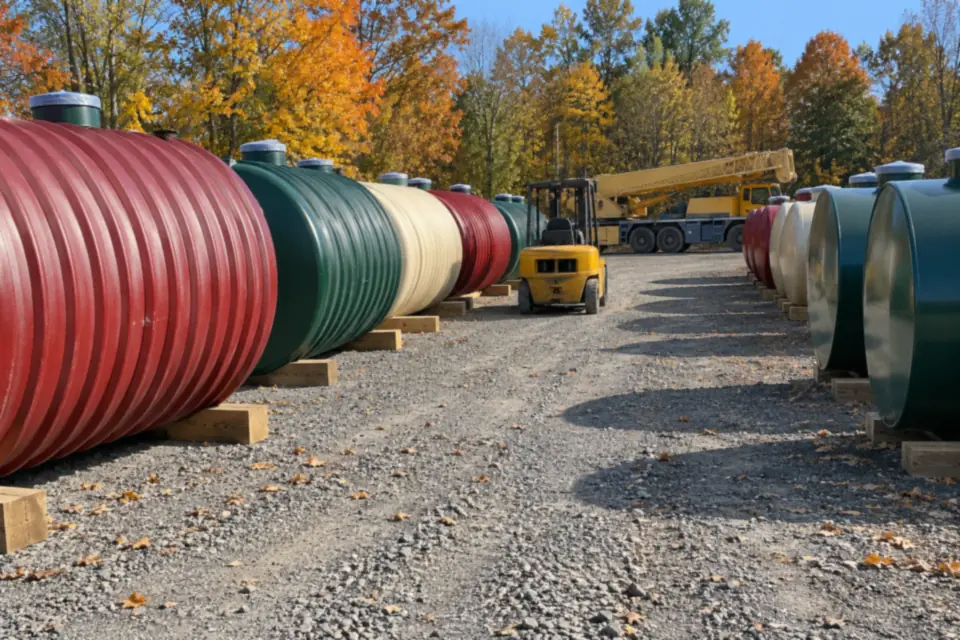
Those figures cover only part of the industry. The IRS table counts stations filed as sole proprietorships, and the IRS does not publish gas station figures for S corporations or partnerships. Net income on those returns was about 2 percent of business receipts, and every tank test and compliance cost comes out of that thin margin.
For a hired manager's pay, the Bureau of Labor Statistics is the better guide. In May 2025, BLS wage data showed general and operations managers at gas stations earning a mean of $70,210 a year and a median of $61,360, while first-line retail supervisors earned a mean of $44,310. An owner who also runs the counter is doing one of those jobs on top of owning the business.
NACS industry data explains why results spread so widely. Fuel produced 65.0 percent of convenience store sales dollars in 2025 but only 38.8 percent of gross profit, so the store decides most outcomes. This page adds the part most earnings guides leave out: the underground tank system, with its testing calendar, insurance rule and cleanup exposure. What it takes to open a site is in the cost to build a gas station guide.
How much do gas station owners make, and why the ranges disagree
Ranges published online rarely say which of three different numbers they measure, and that is the first reason they disagree. Owner salary is a wage line inside the profit and loss statement. Net profit is what remains after that salary is paid. Cash flow before debt service flatters any owner carrying a mortgage and an acquisition note.
Ask any figure which line of the statement it came from before you compare it to your own. The IRS number above is net business income on Schedule C, after expenses but before the owner's income tax. A broker's listing may quote cash flow instead, and the two can differ by the size of a loan payment.
Ownership structure is the second reason. An owner who holds the real estate collects rent from the business and shows a smaller operating profit against a larger balance sheet. A leased site shows the reverse. A gas station manager salary is a hard cost to an absentee owner and a non expense to an owner standing behind the counter sixty hours a week, and the two look identical on a listing.
Many published ranges are not useful to you. National averages blend a rural two dispenser site with a twelve dispenser interstate plaza, and the average describes neither one. How much do gas station owners make is a question about your own gallons, your own inside sales, and your own occupancy cost.
Where the profit comes from, and it is not the pumps
Inside sales carry the business. NACS reports that convenience foodservice and merchandise sales reached $341.2 billion in 2025, up 1.7 percent and the 23rd straight year of growth. Fuel brought in 38.8 percent of gross profit, so about 61 percent came from everything else on the site, and an owner who treats the store as an accessory to the pumps has the business backwards.
Foodservice is the sharpest edge inside the store. It was 28.5 percent of in-store sales and 38.9 percent of in-store gross profit in 2025, and NACS reported prepared food margins of 55.59 percent for 2023. In 2025 other tobacco products, a category that includes nicotine pouches, passed cigarettes in gross profit per convenience store for the first time.
Services are the third leg and the most site dependent of the three. A car wash, air, vacuums, ATM fees and propane exchange each add a line, and parcel pickup can add traffic. Each of these is small on its own. None of them work on a site without the parking and the dwell time to support them.
Adding profit centers is not free. A food program means labor, waste, health permits, and a manager who can run it, and a car wash means water, reclaim equipment, and a maintenance contract. Owners who bolt on a kitchen without adding a person usually end up with a worse store and the same gallons. Match the addition to the labor you can actually hire in that trade area.
| Category | Share of sales dollars | Share of gross profit |
|---|---|---|
| Fuel | 65.0 percent | 38.8 percent |
| Everything else on the site | 35.0 percent | 61.2 percent |
| Foodservice, within in-store sales | 28.5 percent of in-store sales | 38.9 percent of in-store gross profit |
| Prepared food margin | 55.59 percent in 2023 (latest NACS figure found) | Largest single in-store category |
| Other tobacco products | Includes nicotine pouches | Passed cigarettes in gross profit per store in 2025 |
Gas station profit margin per gallon, from pump price to the owner
Gross margin on fuel is not profit, and the gap between the two is most of the confusion in this topic. A gas station profit margin quoted at 40 cents a gallon is the markup, not the take. NACS put the average markup at about 35 to 40 cents a gallon over the five years before 2025, with 2024 averaging 43.5 cents and 2025 averaging above 40 cents.
Card fees are the largest single deduction. NACS reported 8.4 cents a gallon in credit card fees in 2023, and convenience retailers paid a record $21.3 billion in card fees in 2025. Interchange is a percentage of the transaction, so it climbs with the pump price whether or not the margin does. Moving fuel from the terminal to the store takes another 6 cents.
Store level fuel expenses take the rest. In its breakdown of who makes money selling gas, NACS attributes about 6 cents to store operating expense, 2 cents to equipment amortization, and 1 cent to inventory loss. With card fees and distribution, NACS puts the total at about 22 cents of retail expense against a 35 cent gross margin, leaving about 13 cents, and NACS frames 10 to 15 cents as the realistic pretax profit per gallon.
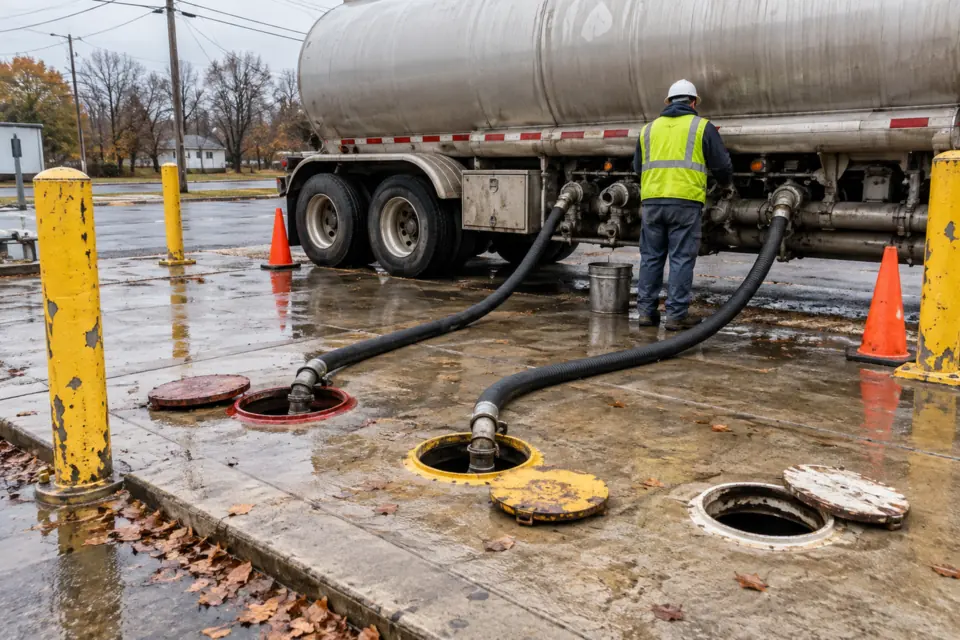
Ten cents and fifteen cents are not the same business at 100,000 gallons a month. That range is $10,000 against $15,000 of monthly fuel contribution, roughly the difference between covering the rent and not covering it. Run the stack on your own numbers instead of adopting anyone's headline, because the inputs that matter are your rack price, your pump price, your card mix, and your delivery cost. The exception is a site pricing fuel near cost on purpose, where profit per gallon is supposed to be thin.
| Line | Cents per gallon | Source and note |
|---|---|---|
| Retail gross margin | About 35 to 40 | NACS five year average before 2025; 43.5 in 2024, above 40 in 2025 |
| Credit card fees | Minus 8.4 | NACS, 2023 figure; a percentage of the transaction, so it rises with pump price |
| Distribution to the store | Minus 6 | NACS expense breakdown |
| Store operating expense | Minus 6 | NACS expense breakdown |
| Equipment amortization | Minus 2 | NACS expense breakdown |
| Inventory loss | Minus 1 | NACS expense breakdown |
| Net margin, pretax | About 13 | NACS arithmetic on a 35 cent margin; the association frames 10 to 15 as realistic |
| Not in this stack | The tank system | Testing, training, and financial responsibility sit below the fuel line |
What a station makes in a day, and why that number is not profit
Daily revenue and daily profit differ by roughly an order of magnitude on the same site.
A site pumping 100,000 gallons a month at $3.00 grosses roughly $10,000 a day in fuel revenue alone, before inside sales. Daily profit on that same site is a small fraction of it. Work the two lines separately. At 100,000 gallons a month and 13 cents of net fuel margin, fuel contributes about $13,000 a month, or roughly $430 a day. Inside sales at $60,000 a month and a 35 percent blended margin contribute about $21,000, or roughly $690 a day.
Those are illustrative inputs rather than a forecast, and they are the two lines to refill with your own numbers. Operating expenses are what a daily figure has to survive. NACS put direct store operating expenses across the industry at just under $166 billion in 2025, growth of 4.2 percent after a 7.1 percent jump the year before. Rent, labor, utilities, maintenance, and insurance all sit inside that line, and a daily revenue number quoted without them is a marketing number.
Traffic is not the same thing as profit, and 2025 made the point. Transaction counts across the industry fell 3.0 percent while basket value rose 24 cents, and basket profitability still slipped 8 cents. Fewer, larger, thinner baskets is a different problem from fewer customers, and it has a different fix. A site whose daily number is holding up on price rather than on volume is borrowing from next year.
What does the tank system cost to keep in compliance?
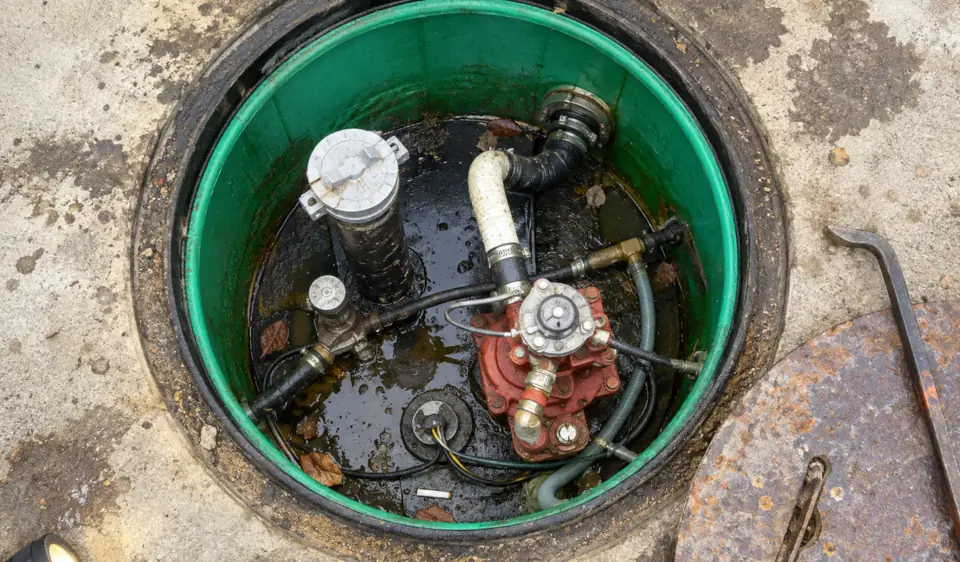
Underground storage tanks come with a compliance calendar that runs whether the site is profitable or not. Under 40 CFR 280.36, owners must run a walkthrough inspection every 30 days covering spill prevention and release detection equipment, plus an annual walkthrough of containment sumps and hand held release detection gear. Missing them is a violation on the next inspection, not a deferred maintenance item.
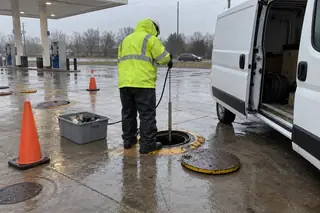
The testing calendar is the part with invoices attached. Spill prevention equipment and containment sumps used for interstitial monitoring have to be tested for liquid tightness at least every three years, with overfill prevention inspected on the same cycle. Release detection equipment is tested annually. Cathodic protection is tested within six months of installation and at least every three years after, with impressed current systems inspected every 60 days. Contractors set their own prices, so ask firms handling tank inspection and testing to quote the annual and three year scopes separately.
Training and insurance are the quieter lines. The Energy Policy Act of 2005 required operator training, EPA's 2007 guidelines created the Class A, B, and C operator classes, and the 2015 rule wrote them into 40 CFR 280 Subpart J. New Class A and B operators must be trained within 30 days of taking the role and Class C operators before they start, so staff turnover makes operator training a recurring task. Under 40 CFR 280.93, tanks at a petroleum marketing facility need at least $1 million per occurrence in financial responsibility for releases.
Some years cost more than others, which is what makes this line easy to underestimate. A light year is walkthroughs, the annual release detection test, and any new operator training. A three year year adds sump testing, overfill inspection, and the cathodic protection survey on top of all of it. Owners who budget from a light year and then meet a three year year experience a scheduled cost as a surprise. The facility owner compliance guide lays out the full calendar.
| Obligation | Frequency | Federal rule |
|---|---|---|
| Walkthrough inspection, spill prevention and release detection | Every 30 days | 40 CFR 280.36 |
| Walkthrough inspection, containment sumps and hand held equipment | Annually | 40 CFR 280.36 |
| Release detection equipment operation test | Annually | 40 CFR 280.40 |
| Spill prevention equipment and containment sump tightness testing | At least every 3 years | 40 CFR 280.35 |
| Overfill prevention inspection | At least every 3 years | 40 CFR 280.35 |
| Cathodic protection testing | Within 6 months of installation, then at least every 3 years | 40 CFR 280.31; impressed current systems inspected every 60 days |
| Internal lining inspection, lined tanks | Within 10 years of lining, then every 5 years | 40 CFR 280.21 |
| Class A and Class B operator training | Within 30 days of assuming duties; retraining if found out of compliance | 40 CFR 280.243 and 280.244 |
| Class C operator training | Before assuming duties | 40 CFR 280.243 |
| Financial responsibility for releases | Continuous | 40 CFR 280.93: at least $1 million per occurrence at petroleum marketing facilities |
When does an old tank system need replacing?
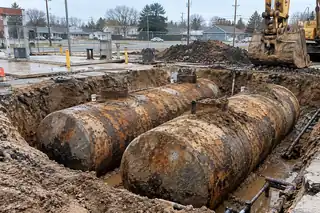
Tank systems have a finite life, and federal rules leave little room for one that falls behind. Under 40 CFR 280.21, any UST system that does not meet the new system standards and was never upgraded must be closed. Tanks and piping installed or replaced after April 11, 2016 must be secondarily contained and use interstitial monitoring, and new dispenser systems need under-dispenser containment.
The age of what you own decides how urgent that is. A system installed before 2016 may be single walled and still legal because it was upgraded with lining or cathodic protection, and its remaining life is an engineering judgment rather than a calendar date. Before you budget, pull the install year, the tank and piping materials, and the last cathodic protection and lining reports.
The trap is treating replacement as a future owner's problem. An aging system with no upgrade plan caps the sale price, because any buyer running diligence prices remaining service life into the offer, exactly as the gas station buyer's due diligence guide describes. Deferring the reserve does not defer the cost. It moves it into the sale.
Replacing early is not automatically right either. A well maintained system with a clean release detection history and a passing cathodic protection survey may have years of service left, and pulling it on a calendar rather than on evidence spends money for nothing. The honest version is a funded reserve plus an annual look at the evidence. Contractors handling tank installation in Ohio or tank replacement in Pennsylvania can scope a phased upgrade against a service life estimate rather than a wholesale swap.
What one release does to a profit and loss statement
A confirmed release converts an operating business into a remediation project with a state case file attached.
EPA's UST questions page estimates the average cleanup at $154,000, and says corrective action for leaks that affect groundwater typically costs from $100,000 to over $1 million. Removal costs land before cleanup costs do, and the UST removal cost guide breaks down what drives them. Set against the IRS profit figures above, a single release can erase many years of owner income.
State cleanup funds are the reason this is survivable for many owners, and occasionally the reason it is not. Where a state fund exists, eligibility often turns on whether the tank system was in compliance at the time of the release. An owner who skipped a three year sump test can see a claim reduced or denied on exactly that ground. Keeping every test record is cheap protection for that claim.
Not every release is catastrophic. A small overfill on a paved forecourt with a working spill bucket, caught the same day and reported, is a far smaller cleanup. What turns a release into a business ending event is time in the ground and time before anyone reported it. The first day costs less than the next six months, every time.
What separates stations that make money from ones that do not
Four things separate the profitable sites from the rest, and none of them is the price on the sign. The first is inside sales per customer, because the store carries the profit and the pumps carry the traffic. The second is occupancy cost, which is fixed and unforgiving. Is owning a gas station profitable comes down to those two before anything else gets a vote.
The third is the condition and age of the tank system, and it is the factor owners control least once they have bought it. The fourth is whether the compliance calendar is funded as a line item or handled as a series of emergencies. Sites that treat testing as scheduled maintenance protect their fund eligibility and their insurance. A station that stops penciling becomes a closed site with redevelopment questions instead of a listing, and owners weighing an exit can read what closing a station involves.
Build your own number before you trust anyone else's. Pull twelve months of gallons and twelve months of inside sales, apply the per gallon stack above to your actual rack and pump prices, then subtract the real occupancy cost. Add the tank lines after that: the annual tests, the three year tests, training, insurance, and a monthly transfer into a replacement reserve sized against the age of your system. What is left is the answer to how much do gas station owners make on your corner.
The tank side is worth getting quoted rather than estimated. A contractor who tests and services systems in your state can price the annual and three year calendar as a service agreement and tell you what your remaining service life looks like while on site. Browse Ohio UST contractors or New Jersey UST contractors, or request a quote with your tank count, install year, and monitoring type. The install year is the number that moves your reserve, and most owners have to go look it up.